Factor Performance
This page presents performance results for the optimal factor specification identified by cross-sectional pricing tests using Liu et al. (2022) test portfolios:
Liu, Tsyvinski & Wu (2022) — VW, 2×3 double sort, sharp-year calendar
This configuration achieved the highest GRS p-value (best cross-sectional pricing) across 288 tested parameter combinations.
Sample: 2013-04-30 to 2026-02-19 (667 weeks)
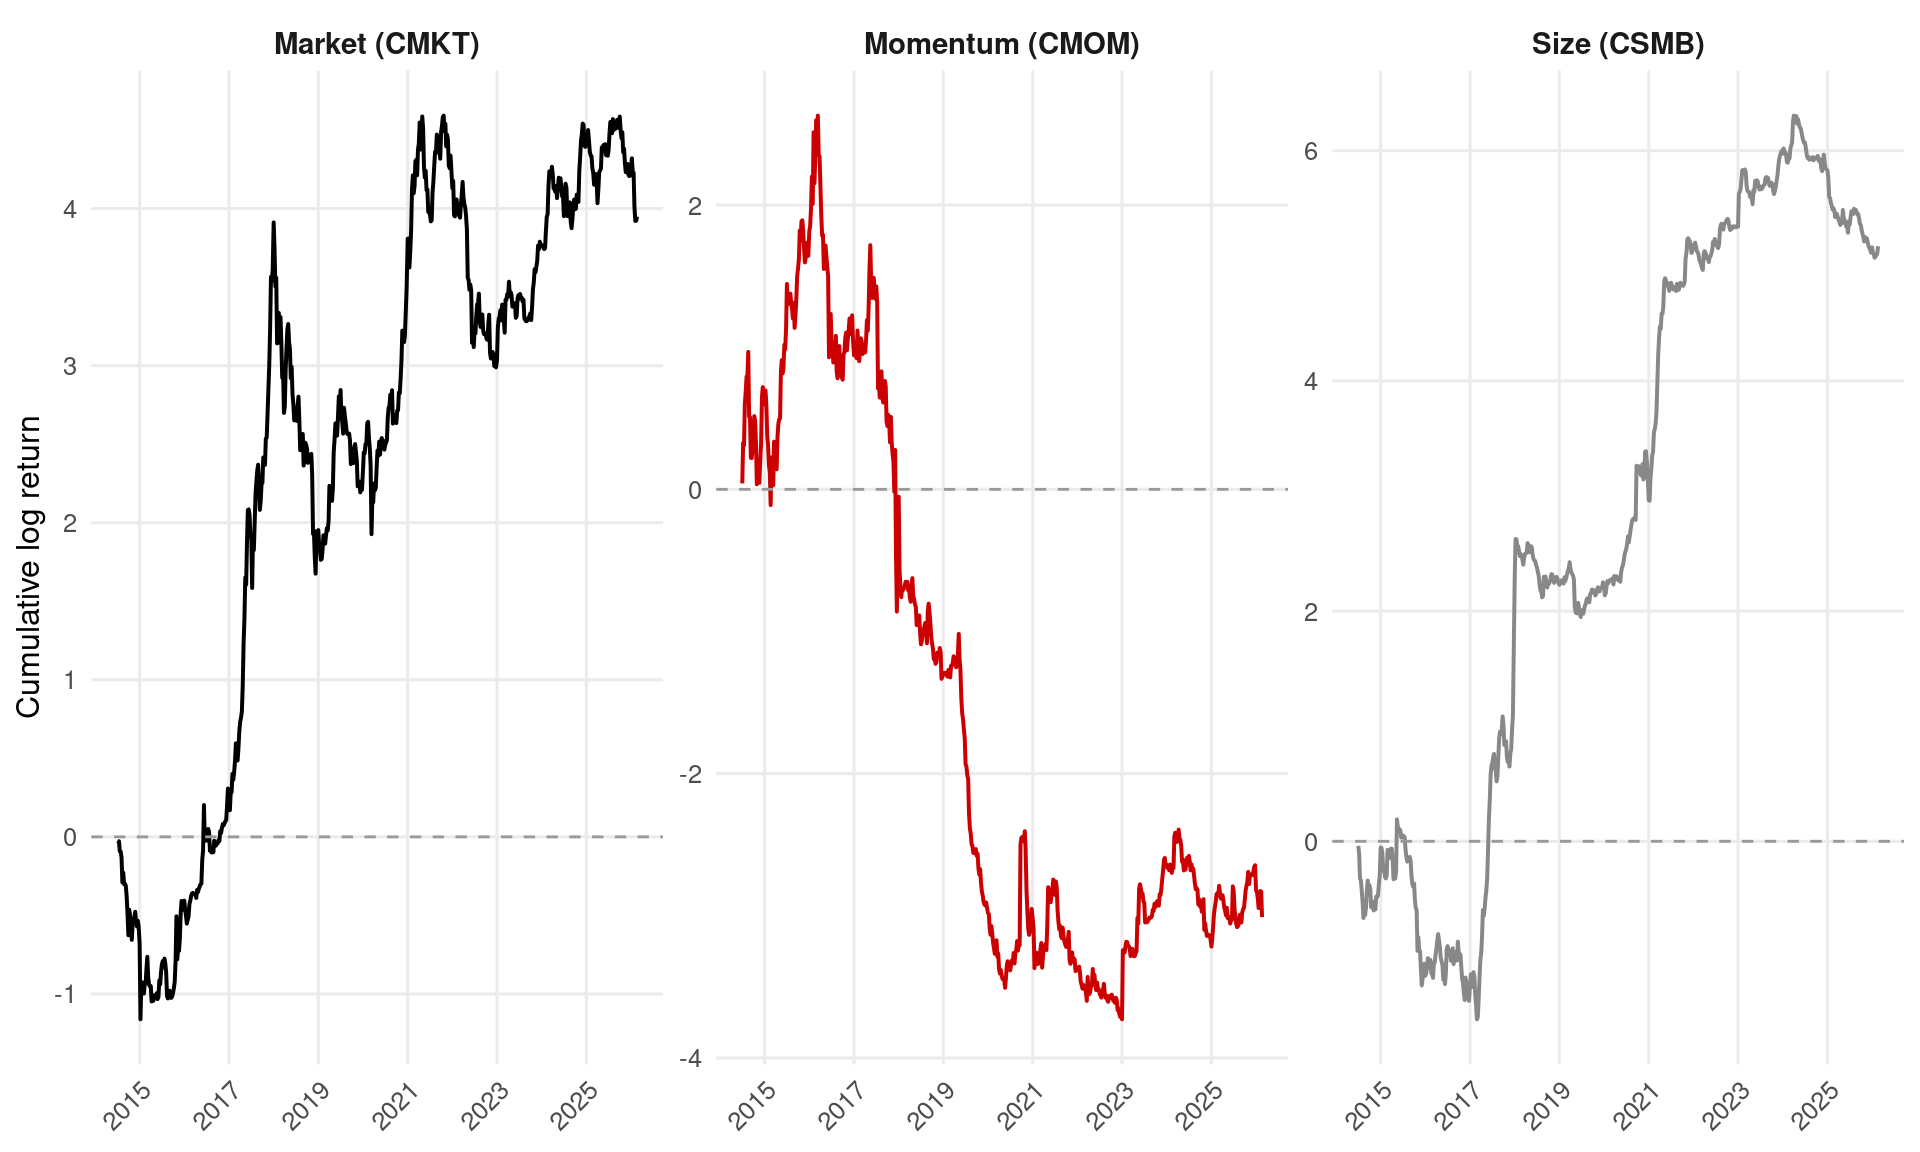
Cumulative Returns
Summary Statistics
| Factor | Mean (%) | Median (%) | SD (%) | Skewness | Kurtosis | Sharpe (ann.) | t-stat | Min (%) | Max (%) | N |
|---|---|---|---|---|---|---|---|---|---|---|
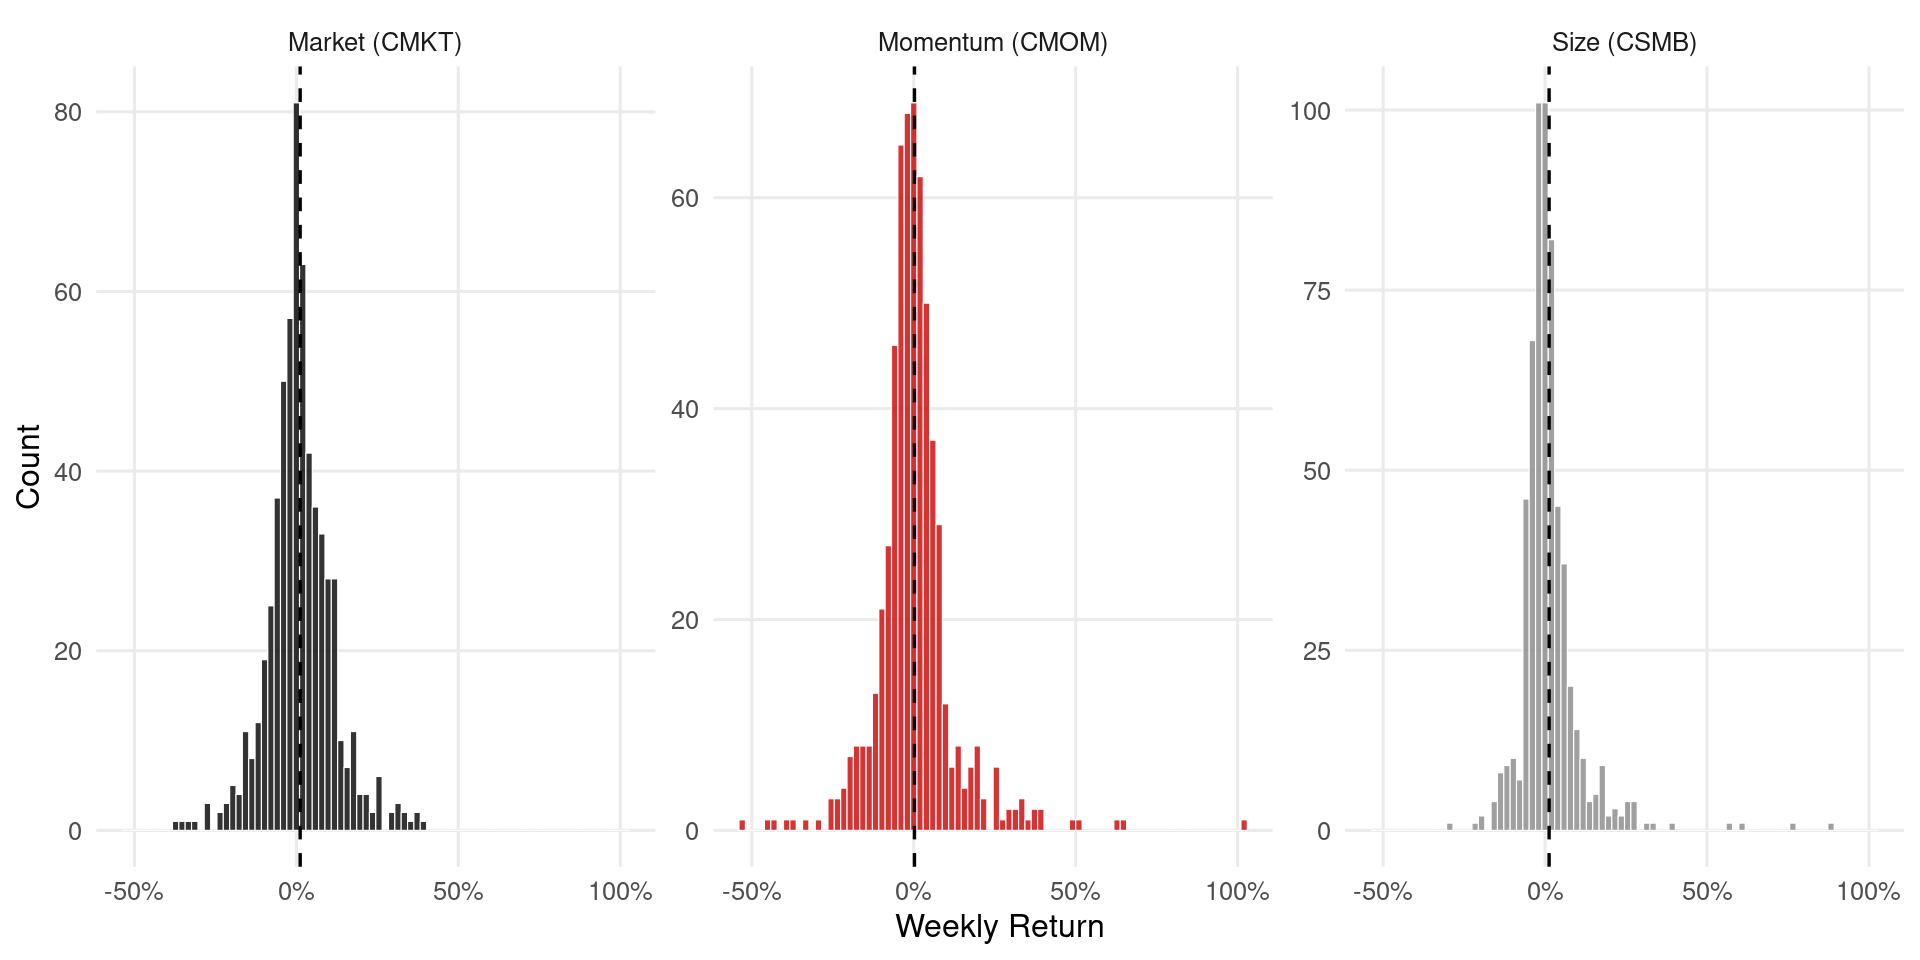
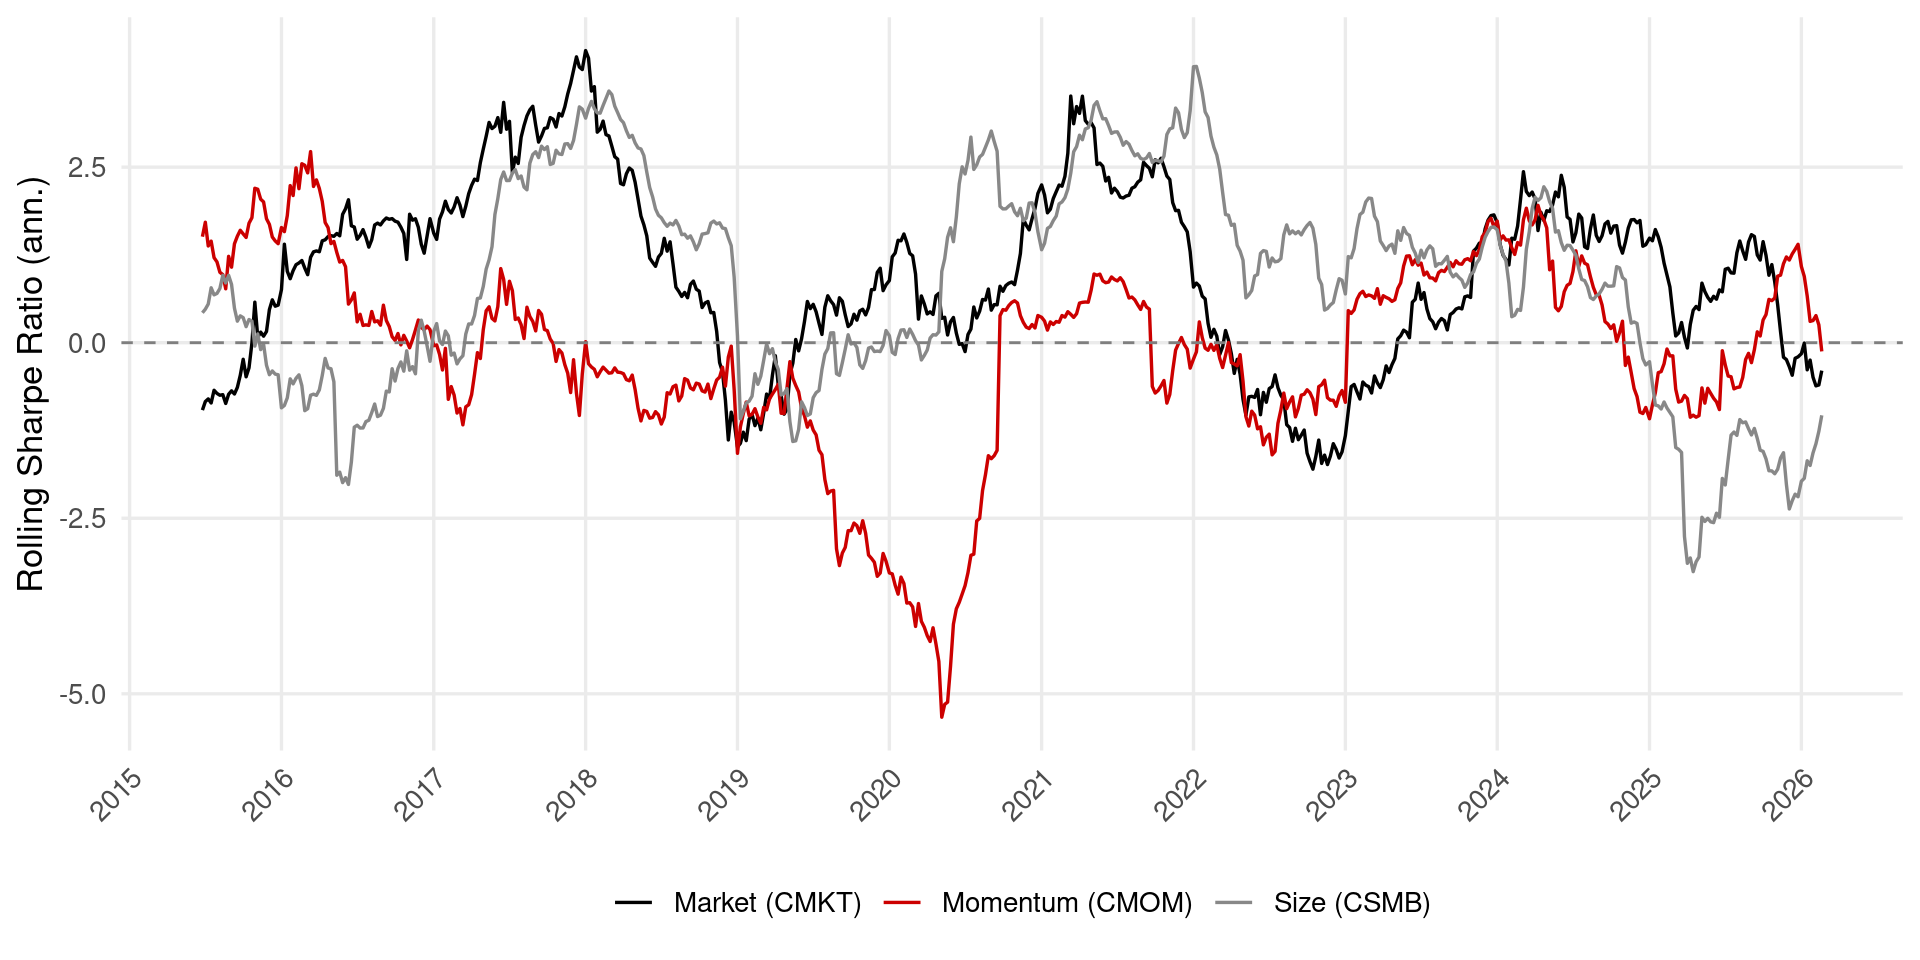
| Market (CMKT) | 1.385 | 0.530 | 11.234 | 1.43 | 14.62 | 0.89 | 3.18 | -38.24 | 104.50 | 667 |
| Momentum (CMOM) | 0.219 | -0.397 | 16.027 | 1.05 | 40.55 | 0.10 | 0.35 | -159.92 | 168.06 | 662 |
| Size (CSMB) | 0.982 | -0.429 | 16.335 | 7.68 | 111.01 | 0.43 | 1.55 | -103.20 | 246.45 | 667 |
Factor Correlations
| Factor | Market (CMKT) | Size (CSMB) | Momentum (CMOM) |
|---|---|---|---|
| Market (CMKT) | 1.000 | -0.046 | 0.134 |
| Size (CSMB) | -0.046 | 1.000 | -0.023 |
| Momentum (CMOM) | 0.134 | -0.023 | 1.000 |
Return Distributions
Rolling Performance
Test Portfolio Performance
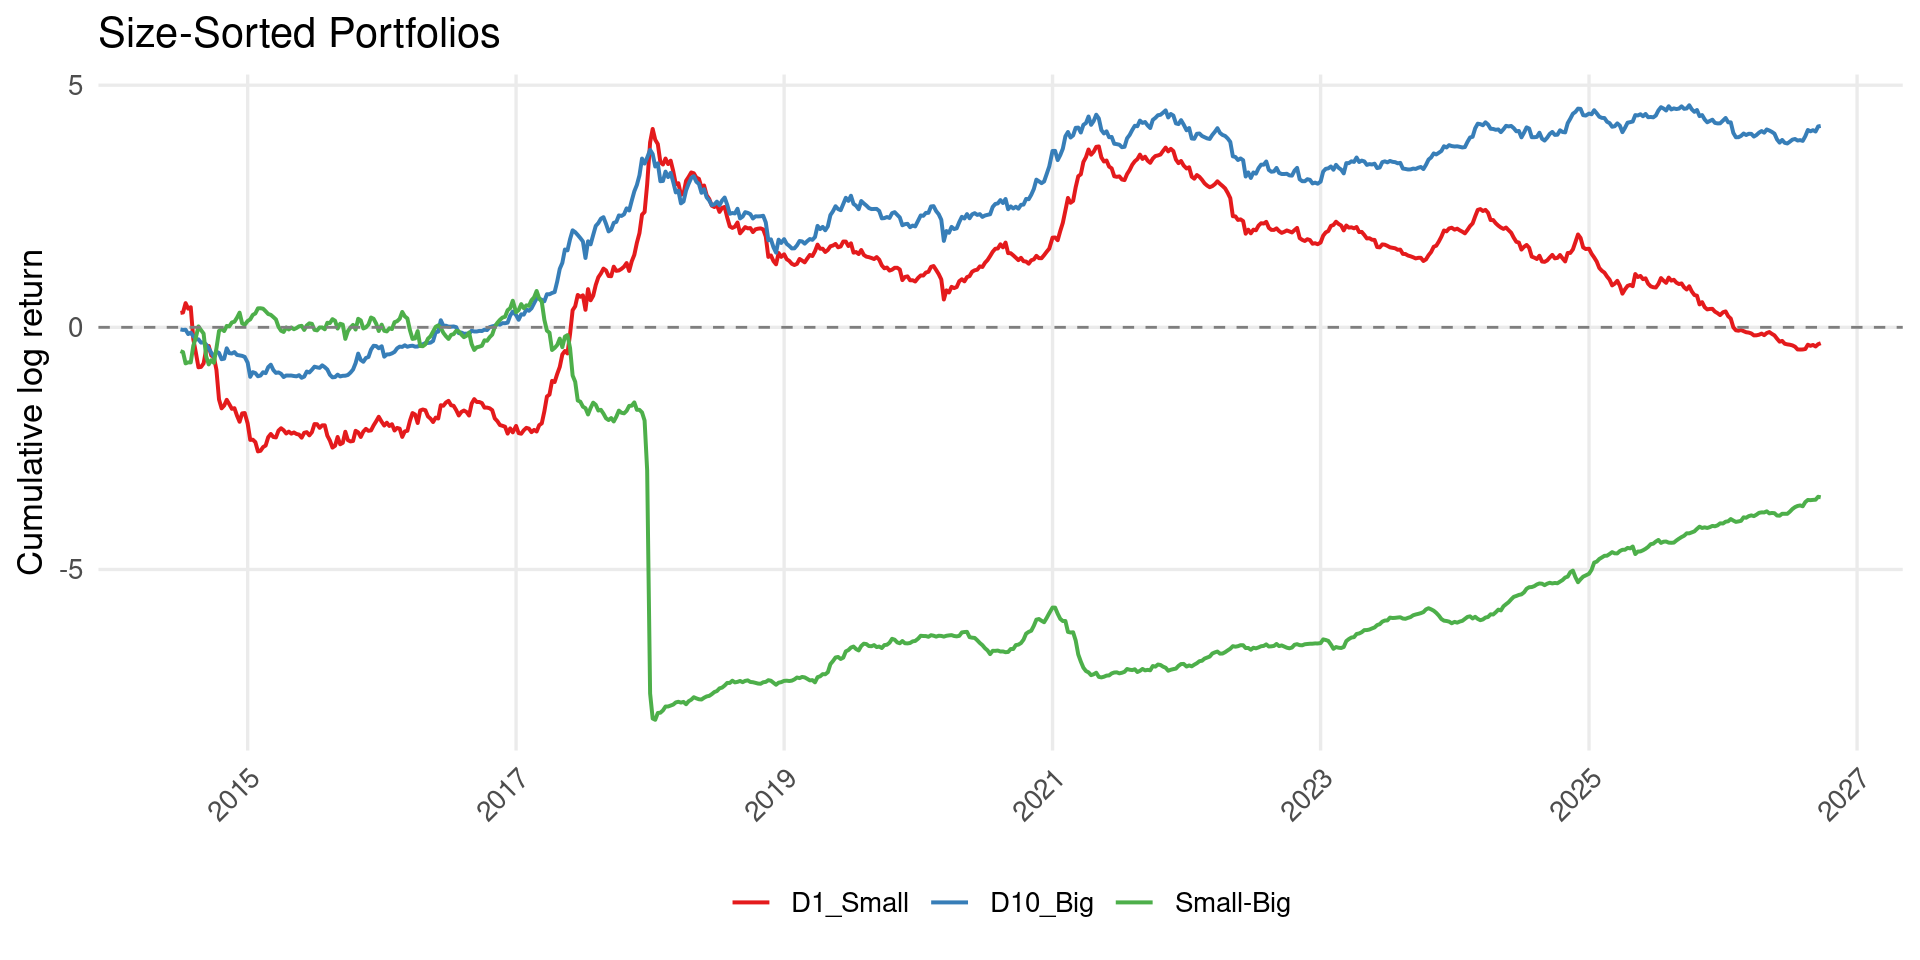
Size-Sorted Portfolios (Decile)
| Portfolio | Mean (%) | SD (%) | t-stat | Sharpe |
|---|---|---|---|---|
| D1 | 0.381 | 15.248 | 0.66 | 0.18 |
| D2 | 0.880 | 16.738 | 1.39 | 0.38 |
| D3 | 1.481 | 28.651 | 1.37 | 0.37 |
| D4 | 1.527 | 36.944 | 1.09 | 0.30 |
| D5 | 0.927 | 22.582 | 1.08 | 0.30 |
| D6 | 1.362 | 28.726 | 1.24 | 0.34 |
| D7 | 0.558 | 16.647 | 0.88 | 0.24 |
| D8 | 1.305 | 17.970 | 1.89 | 0.52 |
| D9 | 0.737 | 15.752 | 1.21 | 0.34 |
| D10 | 1.132 | 10.092 | 2.90 | 0.81 |
| 10-1 Spread | 0.718 | 11.288 | 1.65 | 0.46 |
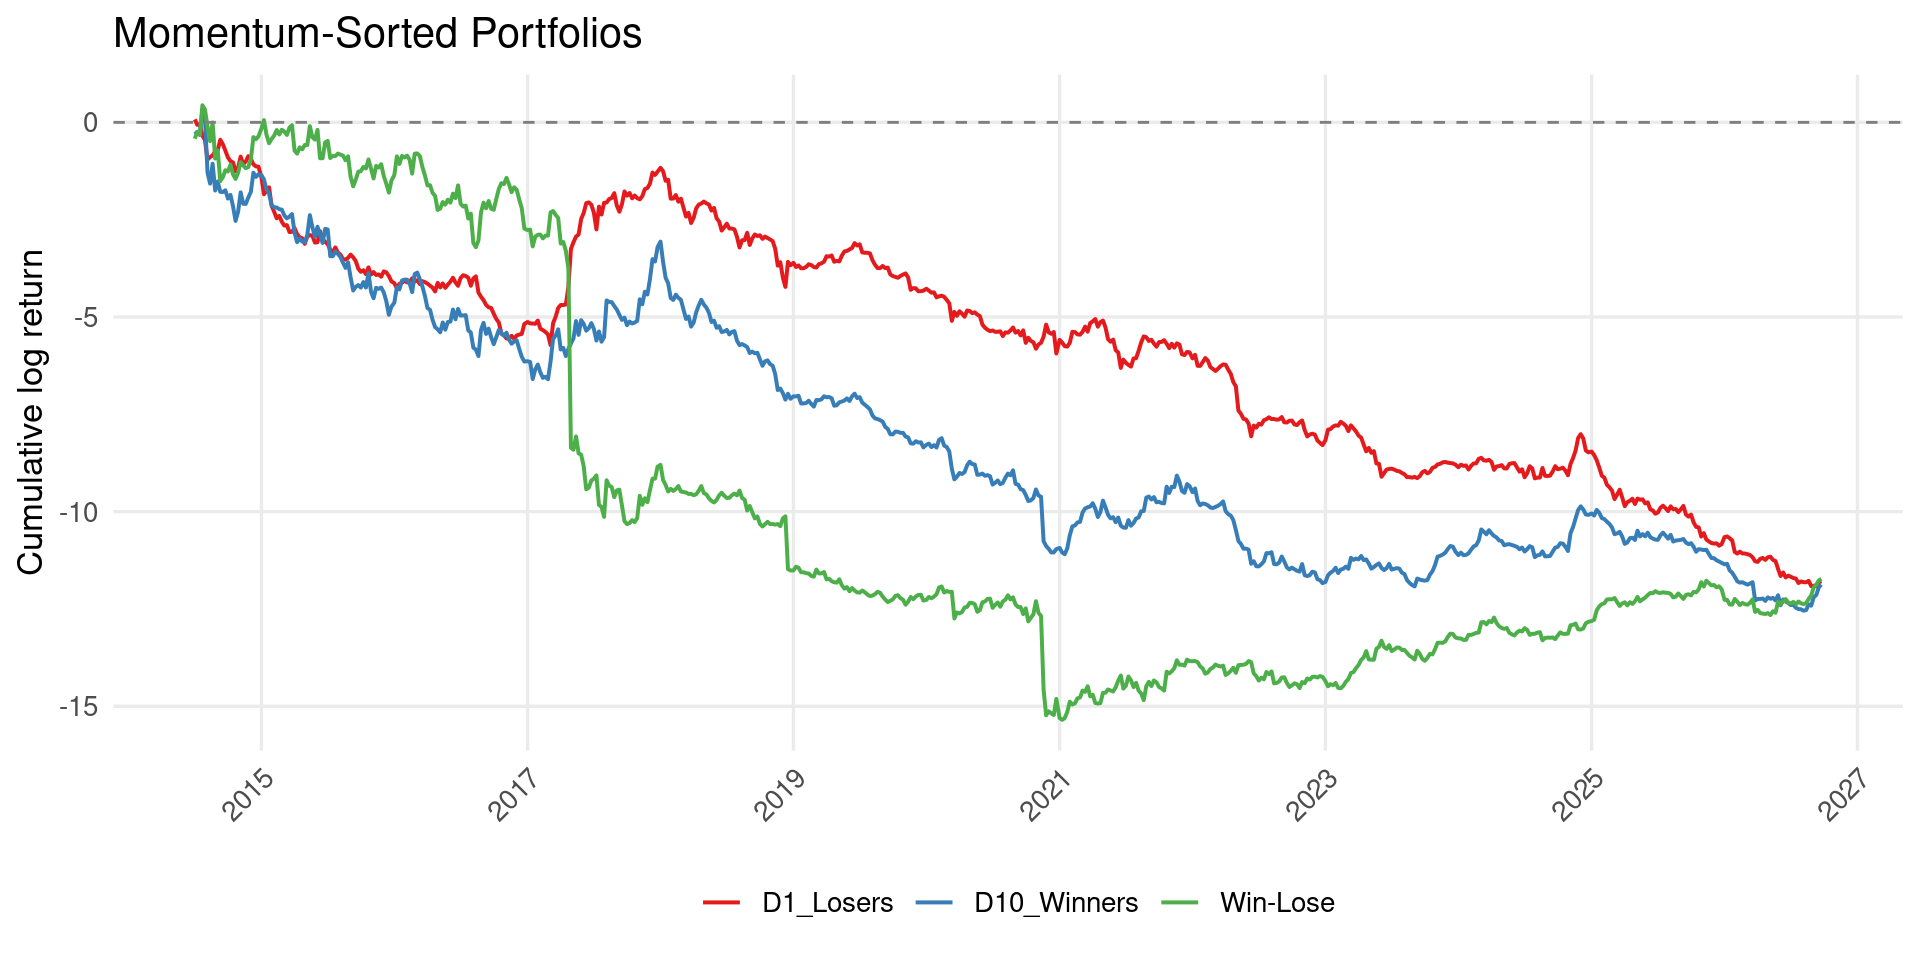
Momentum-Sorted Portfolios (Decile)
| Portfolio | Mean (%) | SD (%) | t-stat | Sharpe |
|---|---|---|---|---|
| D1 | -0.316 | 19.982 | -0.42 | -0.11 |
| D2 | 0.346 | 18.715 | 0.49 | 0.13 |
| D3 | 1.399 | 27.517 | 1.34 | 0.37 |
| D4 | 0.821 | 17.924 | 1.21 | 0.33 |
| D5 | 2.192 | 27.633 | 2.08 | 0.57 |
| D6 | 1.144 | 13.851 | 2.16 | 0.60 |
| D7 | 2.679 | 21.090 | 3.32 | 0.92 |
| D8 | 2.278 | 16.531 | 3.58 | 0.99 |
| D9 | 1.640 | 19.021 | 2.23 | 0.62 |
| D10 | 1.935 | 45.746 | 1.09 | 0.30 |
| 10-1 Spread | 2.381 | 45.812 | 1.34 | 0.37 |
Cumulative Portfolio Returns
Specification Details
This page displays results for the optimal factor specification selected via GRS cross-sectional pricing tests (details). The parameters are:
| Parameter | Value | Rationale |
|---|---|---|
| Weighting | Value-weighted | Best GRS p-value with Liu et al. test assets |
| Size breakpoints | Quintile (5) | Finer than median, less noisy than decile |
| Momentum lookback | 4 weeks | Strongest cross-sectional pricing power |
| Calendar | Monday-Monday | Slightly outperforms Liu et al. sharp-year |
| Exclusions | Stablecoins only | Wrapped/derivative exclusion has marginal impact |
| Delisting returns | Off | Synthetic -100% adds noise without improving pricing |
All other parameter configurations are available for download on the Download Data page.