Data Sources Compared
CoinGecko vs CoinMarketCap: the input universes and the factors they produce
Both providers are survivorship-bias free, but they are not the same market. This page compares them twice: first the input universe (which coins, how many, how large), then the factors each universe produces under the same construction: the standard, with value-weighted terciles, a $1M entry floor and two-week momentum on ISO weeks. Breakpoints are computed from the investable reference set (coins above $100M) or, for comparison, from all coins.
How the two sources are aligned. Every coin carries one identifier across both providers. CoinMarketCap and CoinGecko entries are linked by contract address, project website and social accounts, name and symbol, and each link is confirmed against the price history on all common days (see the Methodology). Both sources are put on the same end-of-day UTC dates and cleaned identically, following the baseline of Fieberg, Günther, Poddig & Zaremba (2024): positive price, market capitalisation and volume; no coin worth more than Bitcoin; a reversal filter for single-day spikes; and weekly returns only from complete daily data. Stablecoins, wrapped/bridged/staked tokens and tokenised traditional assets (stocks, ETFs, gold, treasuries) are excluded.
Note
The investable universe (coins above $100M) holds only a handful of coins before 2018. Comparisons are therefore reported from 2018 onward; earlier years are shown for completeness.
Input universe
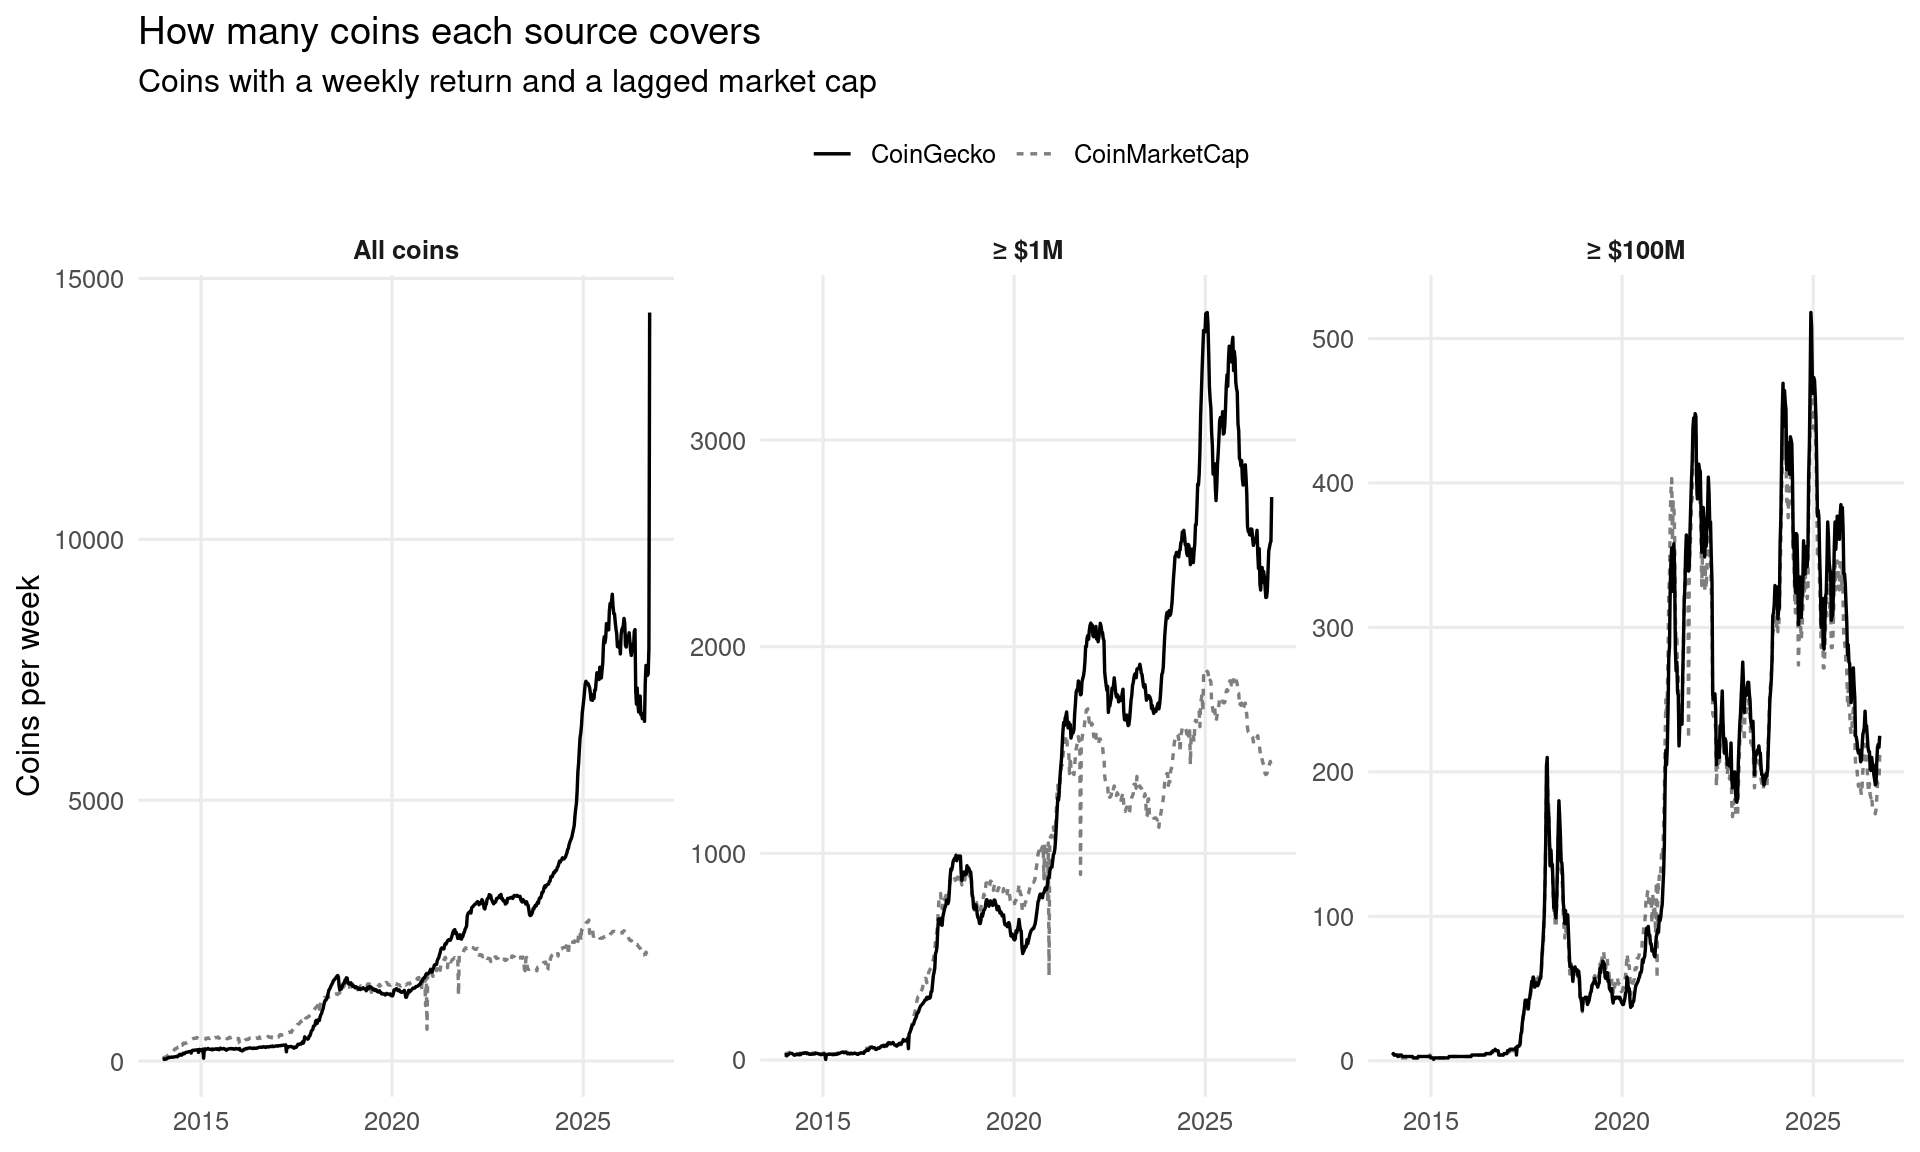
The occasional one-week dips in the CoinMarketCap line (October and November 2020, September 2021) are gaps in CoinMarketCap’s own historical archive: on four days it lists only a fraction of the coins (for example 954 instead of about 3,800 on 30 November 2020), even when downloaded again today. Because a weekly return requires complete daily data, the affected coins drop out for that week. We document these gaps rather than filling them from the other source.
| year | coins (CoinGecko) | coins (CoinMarketCap) | ≥ $1M (CoinGecko) | ≥ $1M (CoinMarketCap) | ≥ $100M (CoinGecko) | ≥ bn) (CoinGecko) | total cap ($bn) (CoinMarketCap) | |
|---|---|---|---|---|---|---|---|---|
| 2018 | 1438.0 | 1275.0 | 889.0 | 866.0 | 101.0 | 92.0 | 278 | 271 |
| 2019 | 1370.0 | 1438.5 | 709.5 | 818.5 | 49.5 | 55.0 | 215 | 218 |
| 2020 | 1381.0 | 1488.5 | 649.5 | 860.5 | 62.0 | 76.5 | 266 | 272 |
| 2021 | 2319.0 | 1943.5 | 1634.5 | 1490.0 | 321.0 | 329.0 | 1831 | 1816 |
| 2022 | 3042.5 | 1984.0 | 1803.5 | 1312.5 | 239.0 | 227.0 | 953 | 958 |
| 2023 | 3097.5 | 1918.5 | 1790.5 | 1261.5 | 231.0 | 220.5 | 1020 | 1019 |
| 2024 | 3893.0 | 2170.0 | 2469.0 | 1578.0 | 360.0 | 347.0 | 2186 | 2167 |
| 2025 | 7592.0 | 2444.0 | 3123.0 | 1763.0 | 342.5 | 315.0 | 3154 | 3134 |
| 2026 | 7863.0 | 2250.0 | 2506.0 | 1540.0 | 217.0 | 193.0 | 2202 | 2160 |
Resulting factors
| Breakpoints | Factor | Weeks | Correlation | Mean CMC (%/wk) | Mean CG (%/wk) | t CMC | t CG | Tracking error (%/yr) |
|---|---|---|---|---|---|---|---|---|
| all coins | CMKT | 457 | 0.999 | 0.53 | 0.54 | 1.2 | 1.2 | 3.64 |
| all coins | CSIZE | 457 | 0.906 | 0.12 | 0.10 | 0.4 | 0.3 | 22.01 |
| all coins | CMOM | 457 | 0.885 | 1.63 | 1.63 | 4.6 | 4.5 | 26.45 |
| investable | CMKT | 457 | 0.999 | 0.53 | 0.54 | 1.2 | 1.2 | 3.64 |
| investable | CSIZE | 457 | 0.967 | -0.53 | -0.63 | -2.0 | -2.5 | 10.25 |
| investable | CMOM | 457 | 0.922 | 1.35 | 1.30 | 4.2 | 4.0 | 19.65 |
| breakpoints | factor | 2014-17 | 2018-19 | 2020-22 | 2023-May 2026 | May 2026+ |
|---|---|---|---|---|---|---|
| all coins | CMKT | 0.97 | 1.00 | 1.00 | 1.00 | 1.00 |
| all coins | CSIZE | 0.90 | 0.97 | 0.82 | 0.79 | 0.60 |
| all coins | CMOM | 0.85 | 0.92 | 0.85 | 0.92 | 0.95 |
| investable | CMKT | 0.97 | 1.00 | 1.00 | 1.00 | 1.00 |
| investable | CSIZE | 0.98 | 0.99 | 0.94 | 0.97 | 0.96 |
| investable | CMOM | 0.83 | 0.92 | 0.91 | 0.94 | 0.99 |
What this means
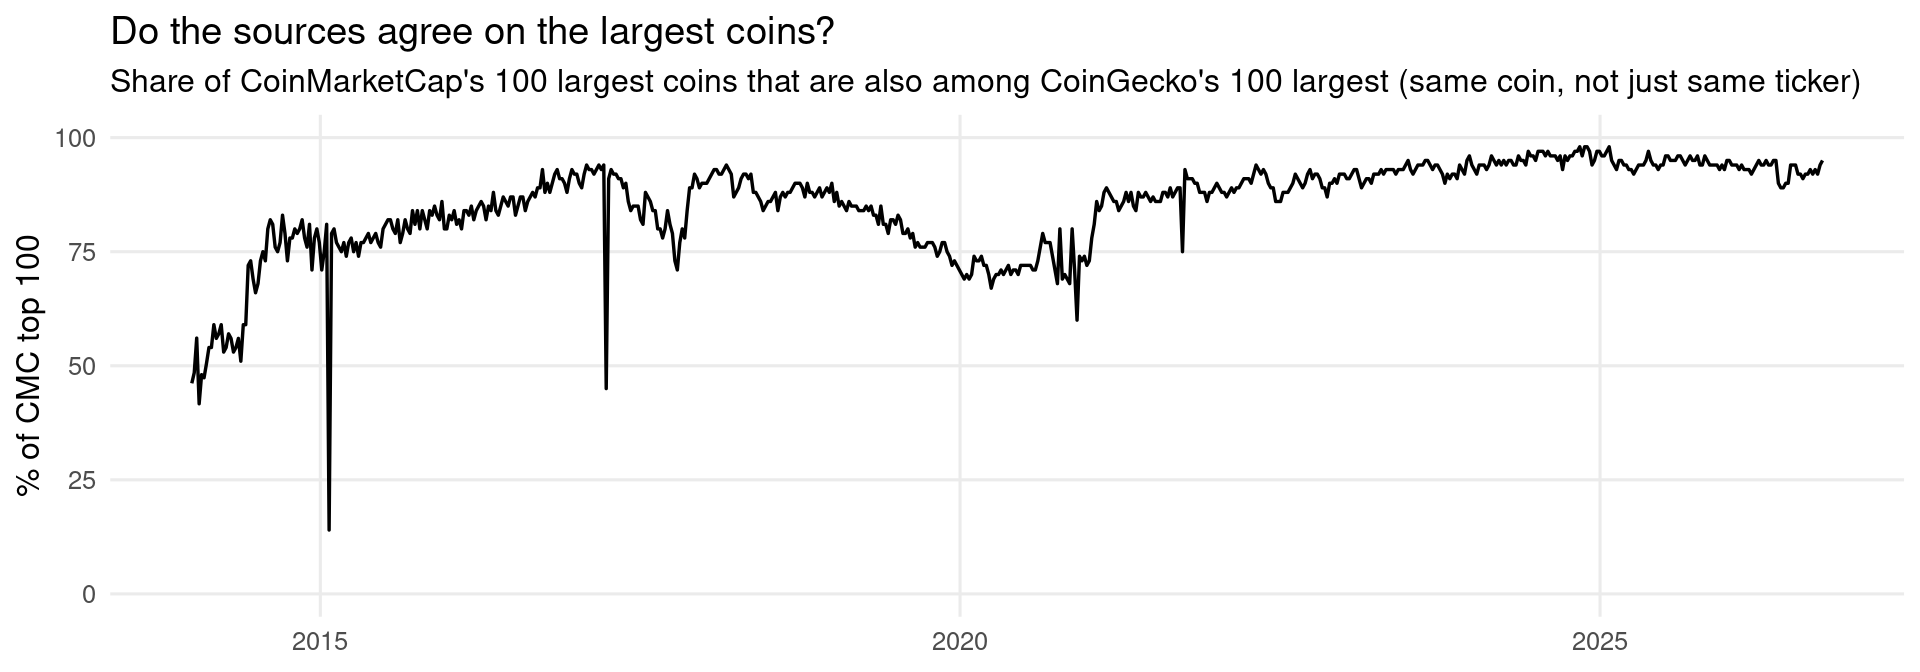
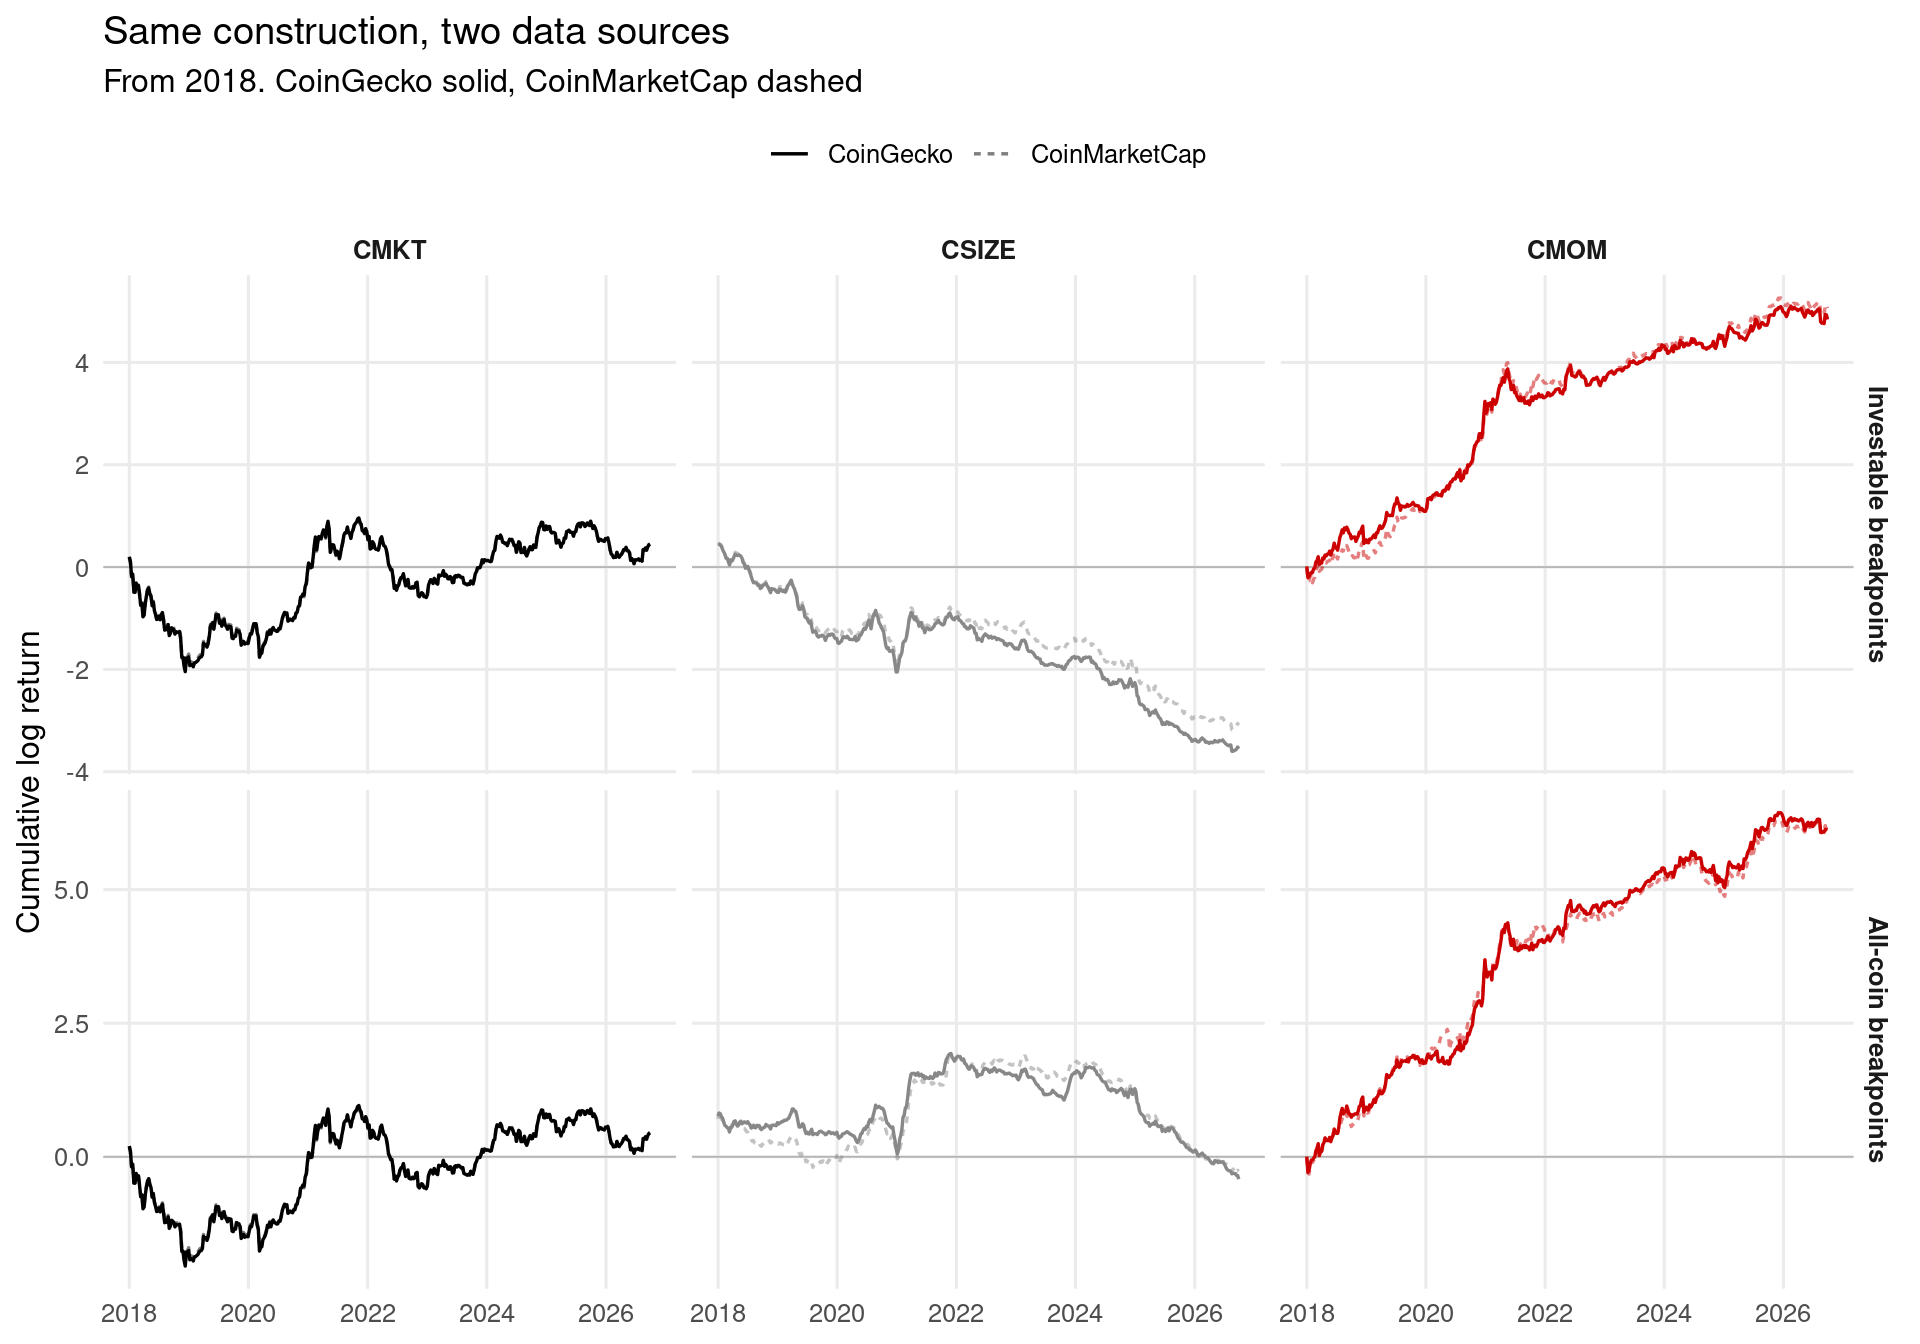
Where the two providers can disagree is in the long tail of small, rarely traded coins: on coin-days with less than $10,000 of daily volume the two sources differ by more than 10% about seven times as often as on liquid coin-days. Restricted to the investable part of the market, the standard factors agree closely from 2018 onward: correlations of 1.00 (market), 0.97 (size) and 0.92 (momentum). The economic conclusions do not depend on the data source: with investable breakpoints the size premium is absent in both, and value-weighted momentum is positive in both.