The Standard
Which crypto factors should you use to show that an investable portfolio has alpha?
Data: 30 Dec 2013 to 4 Oct 2026 (666 weeks) · Last updated: 7 Oct 2026 · next update Monday 12 Oct 2026
While many factor models attempt to price the cross-section of crypto returns, they create a practical problem for fund evaluation. We asked a narrower question: if you want to show that an investable portfolio, fund or trading strategy has alpha, which factors should you benchmark it against?
The usual answer, the factors with the highest Sharpe ratio, does not work in crypto. Factors built from coins nobody can trade in size can look very profitable, and a benchmark that loads on such premia hands spurious alpha to plain passive holdings. A Bitcoin-and-Ether portfolio, for example, loads negatively on a size factor whose positive mean comes from microcaps, and therefore “earns” a positive alpha (Cremers et al., 2012 make the same argument for equity benchmarks). A fair benchmark gives passive investable portfolios zero alpha and prices what investors can actually hold.
Our standard
CMKT, CSIZE, CMOM constructed following the decision tree of Fieberg et al. (2024), with investable breakpoints:
- Database: CoinGecko (CoinMarketCap published alongside), end-of-day UTC prices
- Weeks: ISO weeks (Monday–Sunday, close Sunday 24:00 UTC)
- Winsorizing: none
- Stablecoins, wrapped/bridged/staked tokens and tokenised traditional assets: excluded
- Age: none
- Capitalization: at least $1M previous-week average market cap
- Price: none
- Portfolios: terciles
- Assets: at least 5 coins per leg
- Breakpoints: from coins worth at least $100M; all eligible coins are then assigned
- Weight: value-weighted
- Lag (days): none
- CMKT in excess of the 3-month T-bill; CSIZE = small − big; CMOM = winners − losers on the return of the previous two weeks
CoinGecko is our canonical source. CoinMarketCap series are published alongside and agree closely (weekly correlations over the last year: CMKT 0.99, CSIZE and CMOM above 0.9). Full construction details are on the Methodology page; the files are on the Data page.
How we chose it
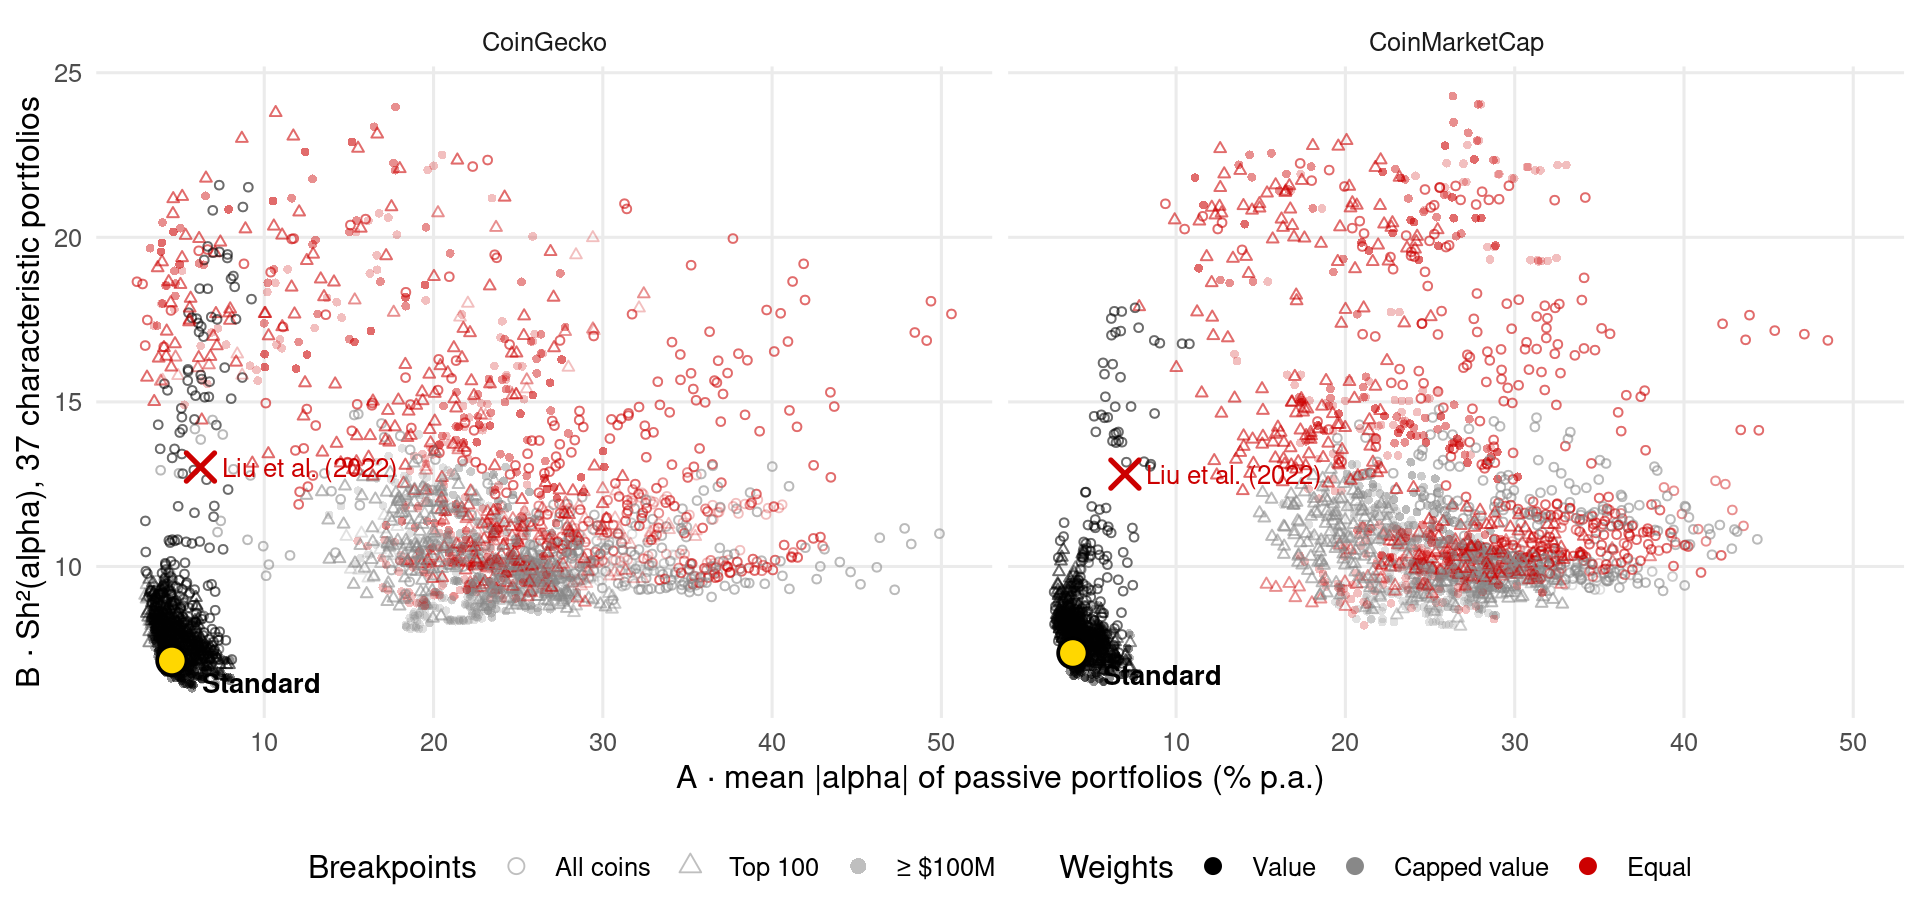
We built 249,024 candidate factor sets. Each combines every option of the ten design choices of Fieberg et al. (2024) with three breakpoint universes, both data sources and eight week calendars, plus the exact construction of Liu et al. (2022). Each was evaluated from 2018 onward (before 2018 only a handful of coins were worth $100M) on:
| Criterion | Question | Measure |
|---|---|---|
| A · Fairness | Do passive investable portfolios get zero alpha? | mean |α| of 18 passive portfolios: BTC, ETH, top-N value/equal-weighted, rule-based replicas of Bitwise 10, S&P Crypto 10, CoinDesk 20, CMC 100 |
| B · Pricing | Do the factors price investable characteristic portfolios? | Squared Sharpe ratio of pricing errors, of 37 long-short portfolios on the characteristics of Fieberg et al. (2024), sorted within coins ≥ $100M; GRS on 1,000 random subsets |
| C · Spanning | Does one model’s factor set explain the other’s? | alphas of one model’s factors on the other’s (Barillas & Shanken, 2017) |
| D · Out of sample | Is the factor set an efficient portfolio out of sample? | tangency Sharpe ratio, weights from one half of the sample, applied to the other |
We judge fairness on the magnitude of the alphas, not on a GRS -value. The GRS statistic is divided by of the factors. Consequently, noisy or illiquid microcap factors with artificially high in-sample Sharpe ratios depress the test statistic and “pass” the test (are not rejected), even while handing passive, buy-and-hold portfolios economically absurd alphas of 20–38% a year.
What the evaluation shows
- Equal weights fail. Against equal-weighted factors, passive portfolios earn alphas of 21–32% a year. Capping value weights at the 80th percentile (Jensen et al., 2023) fails too: in crypto, that percentile is itself a microcap, so capped value weights behave like equal weights.
- All-coin breakpoints fail, including Liu et al.’s. With breakpoints from all coins, Bitcoin gets an alpha of about 13–14% a year against the Liu et al. (2022) factors. The investable characteristic portfolios stay mispriced, and the factors’ out-of-sample tangency Sharpe ratio is negative. Breakpoints from coins worth at least $100M fix all three problems.
- Among investable designs, the simple tercile design beats Liu’s construction. This holds against Liu’s construction with the same investable breakpoints, and it comes from the momentum signal (see below).
| Source | Model | Passive |α| (% p.a.) | BTC α (% p.a.) | Sh²(α) | OOS Sharpe | Beats Liu (≥$100M) in % of bootstrap draws: A / B / D |
|---|---|---|---|---|---|---|
| CoinGecko | Liu et al. exact, all-coin breakpoints | 6.2 | 13.4 | 13.02 | -0.34 | 6 / 0 / 8 |
| CoinGecko | Liu et al. exact, breakpoints ≥ $100M | 5.7 | 3.5 | 7.78 | 0.83 | – |
| CoinGecko | Standard (value-weighted terciles, breakpoints ≥ $100M) | 4.5 | 1.5 | 7.14 | 1.06 | 86 / 76 / 82 |
| CoinMarketCap | Liu et al. exact, all-coin breakpoints | 7.0 | 14.8 | 12.81 | -0.79 | 9 / 0 / 4 |
| CoinMarketCap | Liu et al. exact, breakpoints ≥ $100M | 5.7 | 6.2 | 8.04 | 1.00 | – |
| CoinMarketCap | Standard (value-weighted terciles, breakpoints ≥ $100M) | 3.9 | 3.3 | 7.37 | 1.14 | 96 / 88 / 90 |
The bootstrap resamples blocks of eight weeks 1,000 times. The standard beats Liu’s construction in a majority of draws on every criterion, in both sources, all eight calendars and with or without a one-day implementation lag. None of these differences is significant at the 5% level. The decisive evidence is the spanning test: Liu’s factors do not explain our momentum factor (alpha of about 30–37% a year, –). Our factors explain Liu’s momentum completely (). Two-week momentum sorted into value-weighted terciles carries information that three-week momentum in a size double sort misses.
Why not simply use Liu et al. (2022)?
Liu et al. (2022) is the reference model, and we replicate it exactly. We publish their construction on our data too (see Data). It does not work as a benchmark for investable portfolios, for three reasons:
- With all-coin breakpoints, most of its size and momentum legs consist of microcaps.
- Bitcoin and large-coin index portfolios get double-digit alphas against it.
- The factors’ out-of-sample tangency Sharpe ratio is negative from 2018 onward.
Why not simply use Fieberg et al. (2024)?
We adopt all ten of their design choices and options. Their designs, however, compute breakpoints from all coins, which fails fairness and pricing as above. Two of their weighting options (equal and capped value weights) fail fairness outright. Among their remaining options we chose terciles. Quintiles were the other pre-specified finalist; terciles do at least as well, match Liu’s 30/40/30 convention, and reduce non-standard errors (Fieberg et al., 2024, Table 6).
Which day should the week end?
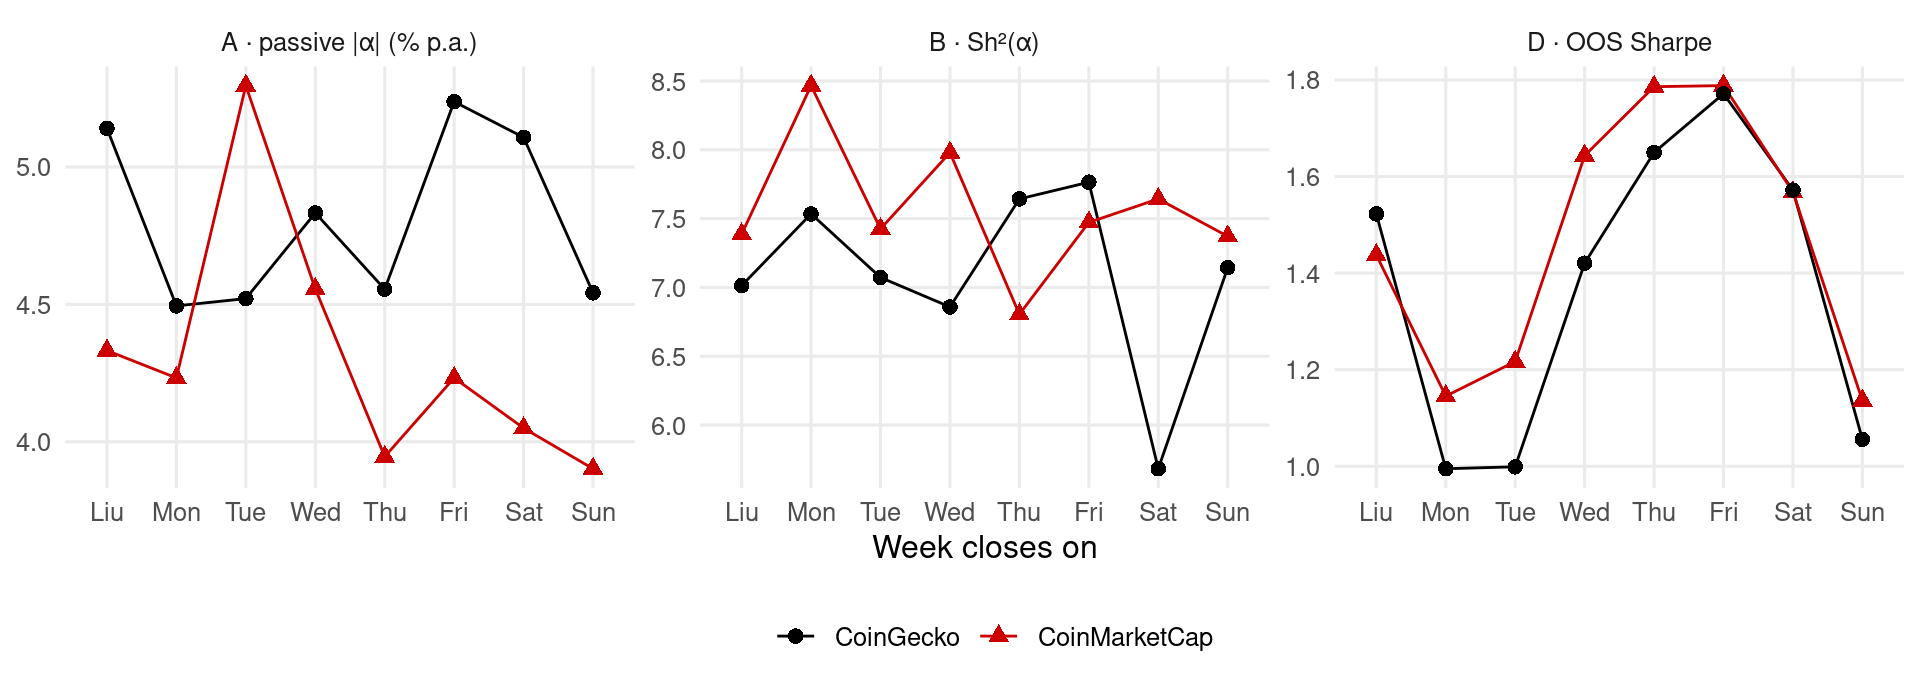
The calendar matters: weekly numbers change with the closing day. But no day is better on every criterion in both sources. Weeks closing on Tuesday price the CoinGecko characteristic portfolios well, for example, but leave Bitcoin one of the largest alphas. We therefore fix the calendar by convention: ISO weeks closing Sunday 24:00 UTC, which anyone can reproduce. The standard is also published on all eight calendars, including the 52-week calendar of Liu et al. (2022), so that you can match the week your own returns are measured on.
Using the standard
Regress your portfolio’s weekly excess return on the three factors over the same weeks:
Measure your returns from Sunday 24:00 UTC to Sunday 24:00 UTC (or download the calendar that matches yours). If your strategy trades with a delay, use the _lag1 series. See the Data page for files and code.
The full evaluation is reproducible from the research release on Hugging Face (the multiverse/, evaluation/ and test_assets/ folders). It is also described in our working paper.
References
Barillas, F., & Shanken, J. (2017). Which alpha? The Review of Financial Studies, 30(4), 1316–1338.
Cremers, M., Petajisto, A., & Zitzewitz, E. (2012). Should benchmark indices have alpha? Revisiting performance evaluation. Critical Finance Review, 2(1), 1–48.
Fieberg, C., Günther, S., Poddig, T., & Zaremba, A. (2024). Non-standard errors in the cryptocurrency world. International Review of Financial Analysis, 92, 103106.
Jensen, T. I., Kelly, B., & Pedersen, L. H. (2023). Is there a replication crisis in finance? The Journal of Finance, 78(5), 2465–2518.
Liu, Y., Tsyvinski, A., & Wu, X. (2022). Common risk factors in cryptocurrency. The Journal of Finance, 77(2), 1133–1177. https://doi.org/10.1111/jofi.13119